Sort a line chart by the Y axis in Power BI
Are you struggling to find a way to sort a line chart by the values in the Y axis? Come learn how to get around that!

Data Lounge: Better Reporting With UX & UI
I was invited onto Data Lounge to talk about how we can repurpose UX/UI design principles to improve our BI reporting.
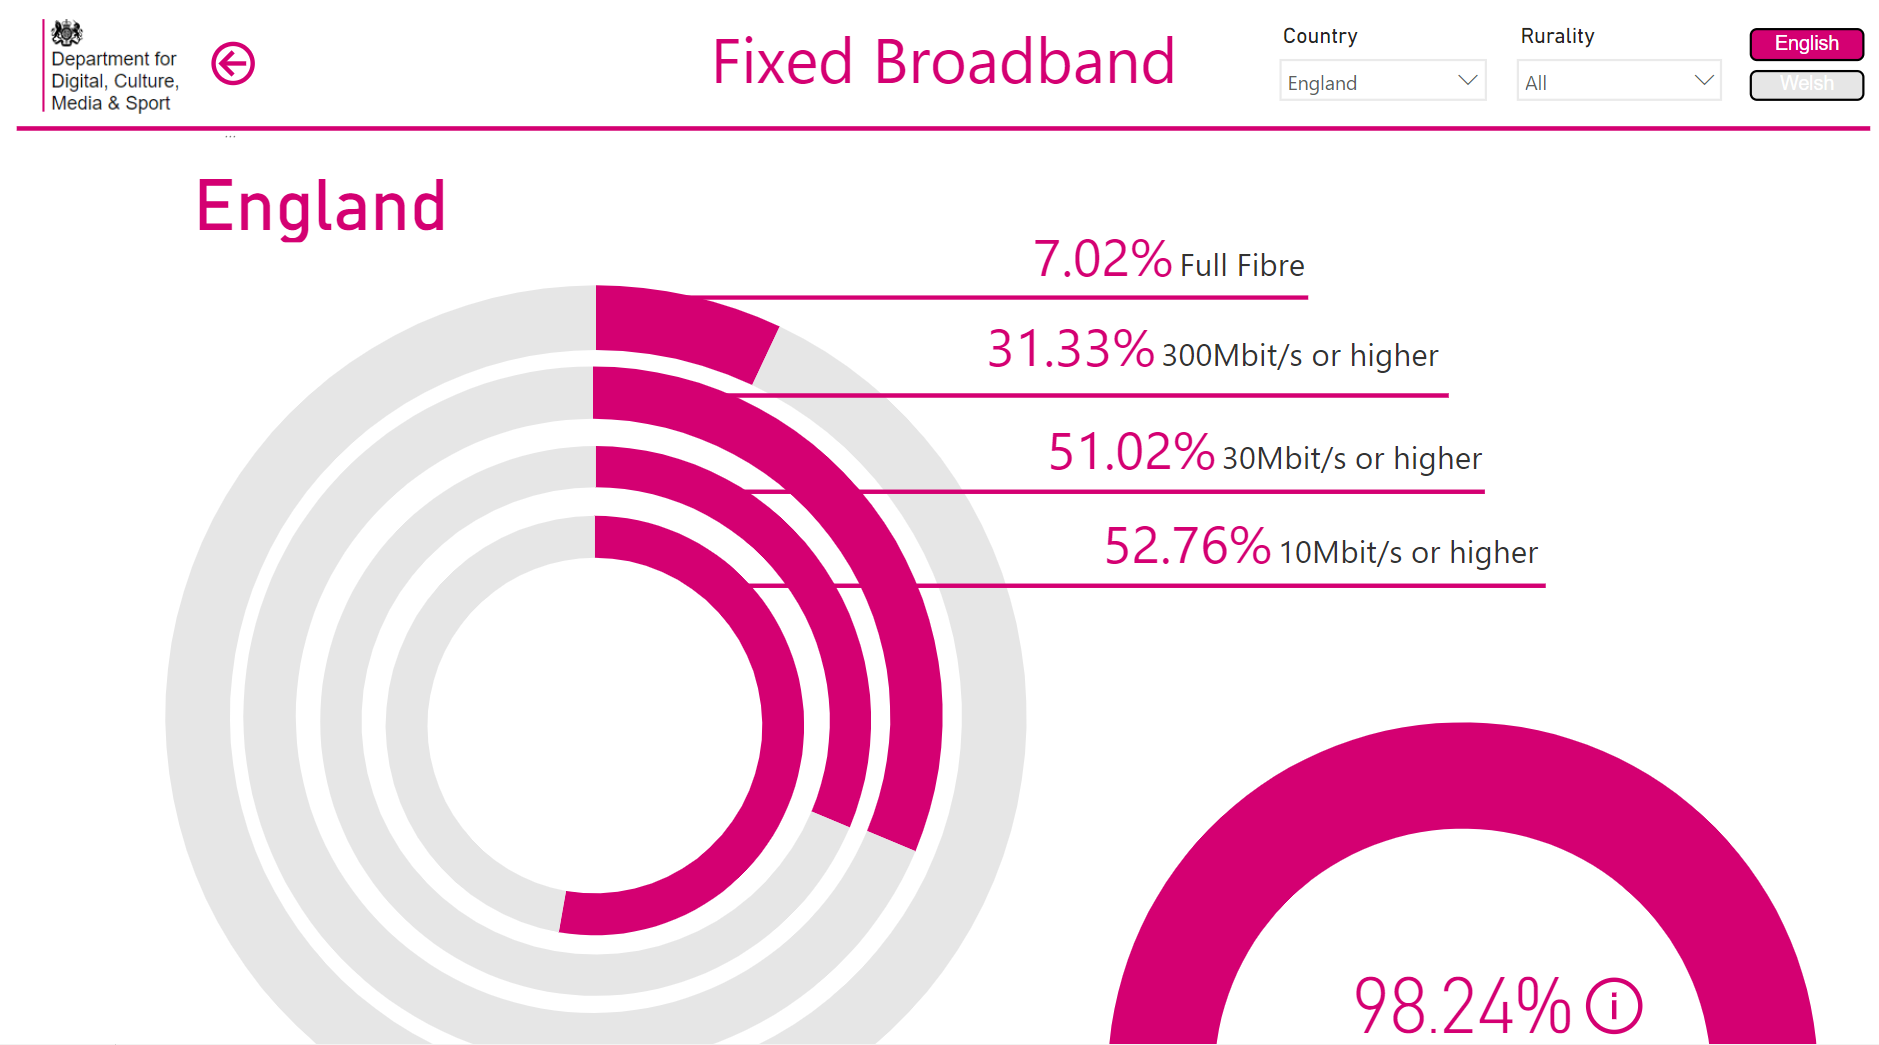
London PowerBI User Group Data Challenge Entry
My entry for a data visualisation competition for the London PowerBI User group