Sort a line chart by the Y axis in Power BI
Hello again everyone! Hope you are all enjoying lockdown life.
While this post will focus on a very specific example, the technique will allow you to sort data in a line chart using the values in the Y axis. For most BI reporting I think users won’t care how line chart data is sorted, but when we are thinking about more scientifically orientated visuals, this might be quite a common ask!
My current project is based around Oil wells. The physics and calculations that go into deciding where to drill etc. is very interesting (if a bit niche!). However, this has produced some really interesting requirements from clients for specific visuals. One of the staple plots required by the geologists is known as a depth plot, or a well log. This basically visualises depth against a whole range of measures. For this example we will plot depth (ft) against pressure (PSI). There are a few peculiarities in these charts that pose challenges for development in Power BI.
As an example, a standard pressure v. depth plot looks something like this:

I didn’t want to get into the weeds of copyright restrictions on published images of these plots but if you want to take a look click here to see some on google. Usually these plots are a bit busier but we just have two “curves” for this example. Also, just to point out all the data used in this example is dummy data!
So a few things to note here - Depth is traditionally plotted on the left (y axis) and runs from 0 down. Then we have Pressure along the bottom (x axis). Note also all the pressure jumps we see at specific depths jump horizontally. If you check out some professional depth plots on google, you’ll see this is pretty standard.
At it’s core this is a really simple chart that plots a column of values / integers against another column of values / integers.
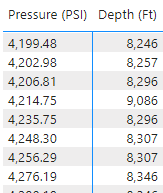
The data we are using for this example is also very simple (typically you would have a lot more data of course, but for this example I have only generated columns I will use)
You can see in our data we have two columns which are our Depth and Pressure respectively. We also have a column to identify which “curve” that data belongs to. So to build the desired plot we should just be able to throw those two values in a line chart, and stick the curve ID into legend and be done!

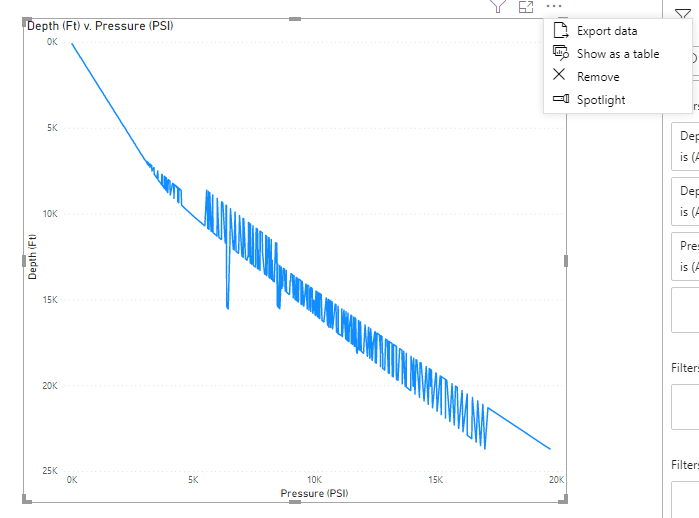
Except we see some strange behaviour here. Where we would want to see a horizontal jump in pressure we are instead seeing a vertical one. If any of you reading this are used to seeing these plots, I bet this looks super wrong to you!
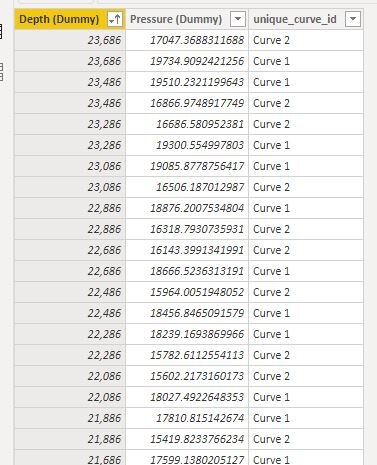
It took me a little while to figure out what is going on here. When PowerBI plots a line chart, it actually plots all the values on the x axis first, and plots the y values against them. This is a little tricky to explain with words - so here is a screenshot of the data table which plotted the chart above.
We can see from this table, that Pressure is sorted in an ascending order, from low to high. But Depth should look odd to you - it isn’t ordered at all. This is because PowerBI takes the value on the X axis, and then plots whatever the Y value is against it, regardless of the order we might want the Y axis to adhere to. This is why those little pressure jumps are vertical, instead of the desired horizontal. To fix this, we just need to sort the line chart by the Y axis. Those of you familiar with PowerBI might have already guessed the problem - you can’t apply a sort order to a line chart with two continuous variables - PowerBI will always plot these charts according to the order of the variable in the X axis.
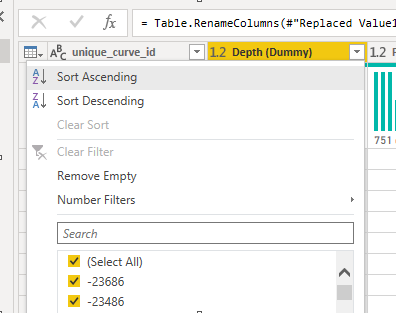
In that screenshot you can see the option to sort is not available. If we can’t sort a continuous variable - perhaps we could try changing pressure to a categorical variable - that would allow sorting!

This does sort of work - it will allow us to sort our values by the Y axis. But as you can see along the bottom it means the Pressure value is plotted as a set of discrete figures, so every single value in our dataset gets it’s own space, instead of plotting along a scale, like when it was a continuous variable. You can see the horizontal scroll bar to give some indication of just how wide this chart has ended up being! Also, horizontal scrolls are horrible for UX, as most regular users won’t encounter horizontal scrolls that often, and may not even realise it is an option.
Back to the drawing board.
So. Power BI won’t let us sort by the Y axis if both values are continuous numerical values. But we can’t use Pressure as a categorical value because it looks awful.
Therefore the only solution left would be to somehow sort the data, before it even goes in the chart. We would need to sort the Pressure column by the Depth column to get the desired effect. Fortunately Power BI does allow us to do that;

There are several ways to do this, in this example I selected the column I wanted to sort in the Report view and then selected Column Tools from the top ribbon. There was can see an option to sort a column by another column. Success?

No.
So what is the problem? PowerBI can’t sort a column based on another column where there are duplicate values, I’m assuming as it doesn’t have a mechanism to decide where to put the duplicate columns in the sort order. In this data because we just have pairs of integers the risk of duplicate values is quite high, especially when we start adding more data.
But, it’s a step in the right direction. All we need to be able to sort this chart with the Y axis is a column to sort by that would maintain the order we want, and also be guaranteed to contain no duplicates, no matter how many different wells we throw in there. However, we also don’t want to modify our data to try and create unique values.
To do this we’ll need to jump into the query editor. Here we can sort our data table by any column we choose. In this case, because the sort order we want is depth we can sort by depth:
Now our data is in the order we want it to be and we’ll just need to generate a new column which can preserve this order, while containing no duplicate values. Fortunately, this is super easy as we can just add an index column -

This index column will update if we add new data, and will only ever contain unique values (we can see that in our column analysis!). Also, no matter how much more data we add, this solution will work, as the sort and index is applied each time we refresh, so we don’t have to worry about breaking this by adding new data in.
Now we simply have to sort the X axis variable by our index column - and hey presto - a line chart sorted by the Y axis!

As I said at the top - this use case is very specific, but I tihnk the principles covered here might have some value for challenges you guys face in your jobs. Hope you find it helpful!